Accuracy stayed the same. Confidence changed.
I built Calibration Explorer to compare a classifier’s confidence with its observed accuracy. In this worked example, temperature scaling changes the probabilities while every predicted class stays the same. The app is also available on Hugging Face.
Start with your own predictions
For predictions made with 80% confidence, are about 80% correct? Calibration Explorer gives that question a practical workflow: import predictions with known outcomes, inspect confidence and accuracy, and export the measurements and settings.
I built the browser interface, strict input checks, calibration and threshold workflow, and report exports around my calibrated TypeScript library. The app does not train or run a classifier. A confidence CSV is enough to inspect calibration; temperature fitting requires the original class logits and true labels. Imported observations are processed in the browser.
Keep fitting separate from evaluation
The bundled reference is a multinomial logistic-regression classifier trained offline on the UCI handwritten-digits dataset. It is a small, reproducible example, not a model trained by the web app or evidence about modern classifiers in general.
Of the original training observations, 2,675 train the classifier, 574 fit its temperature, and 574 provide policy-validation data for assessing an acceptance threshold. All 1,797 original test observations remain outside model and temperature fitting. The saved input contains the classifier’s raw logits, class labels, and split membership.
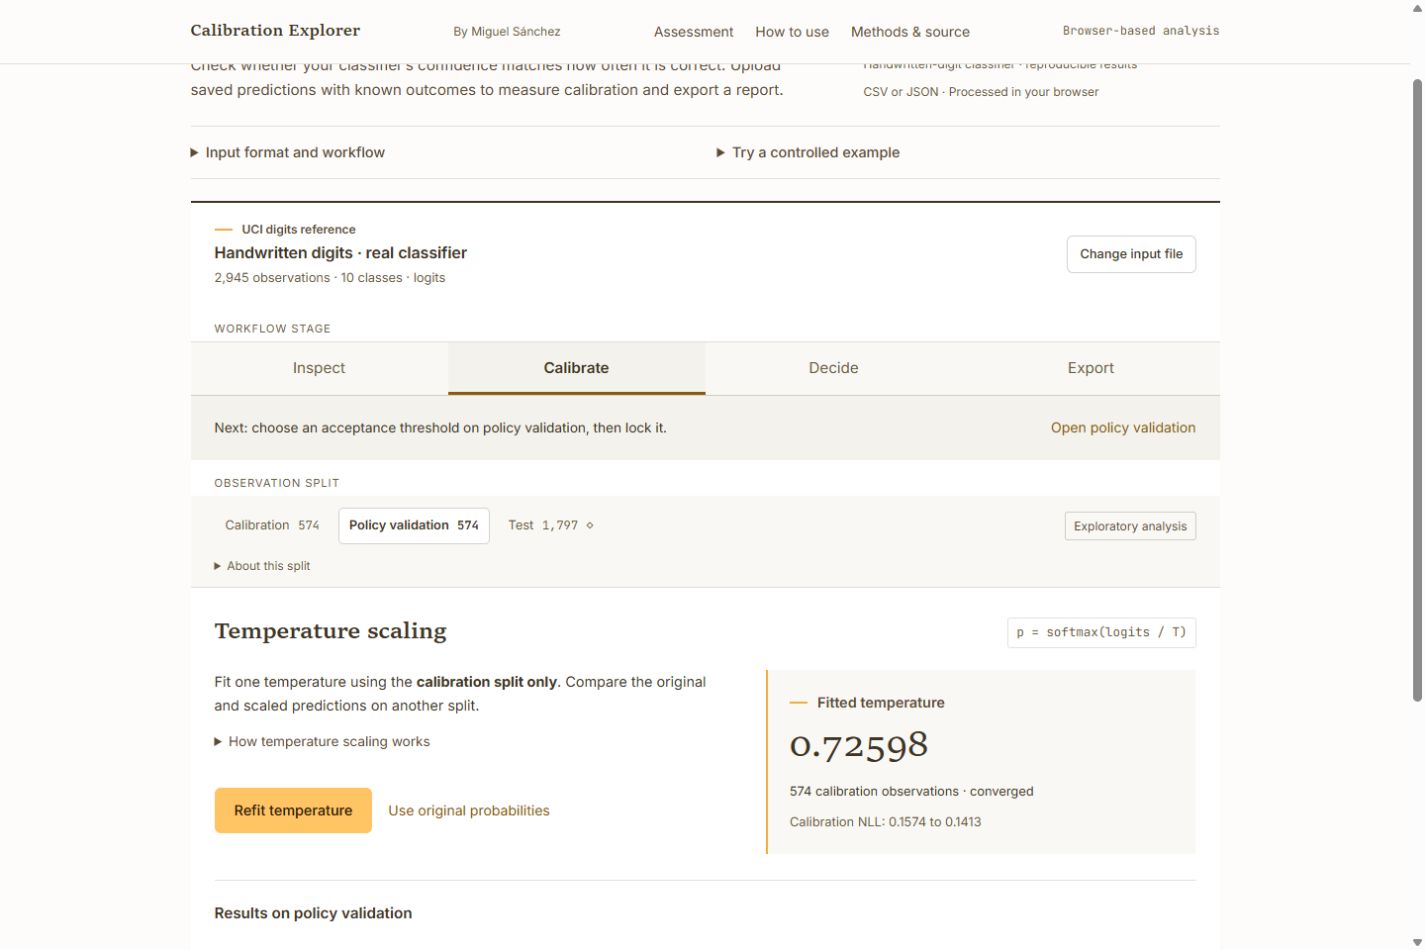
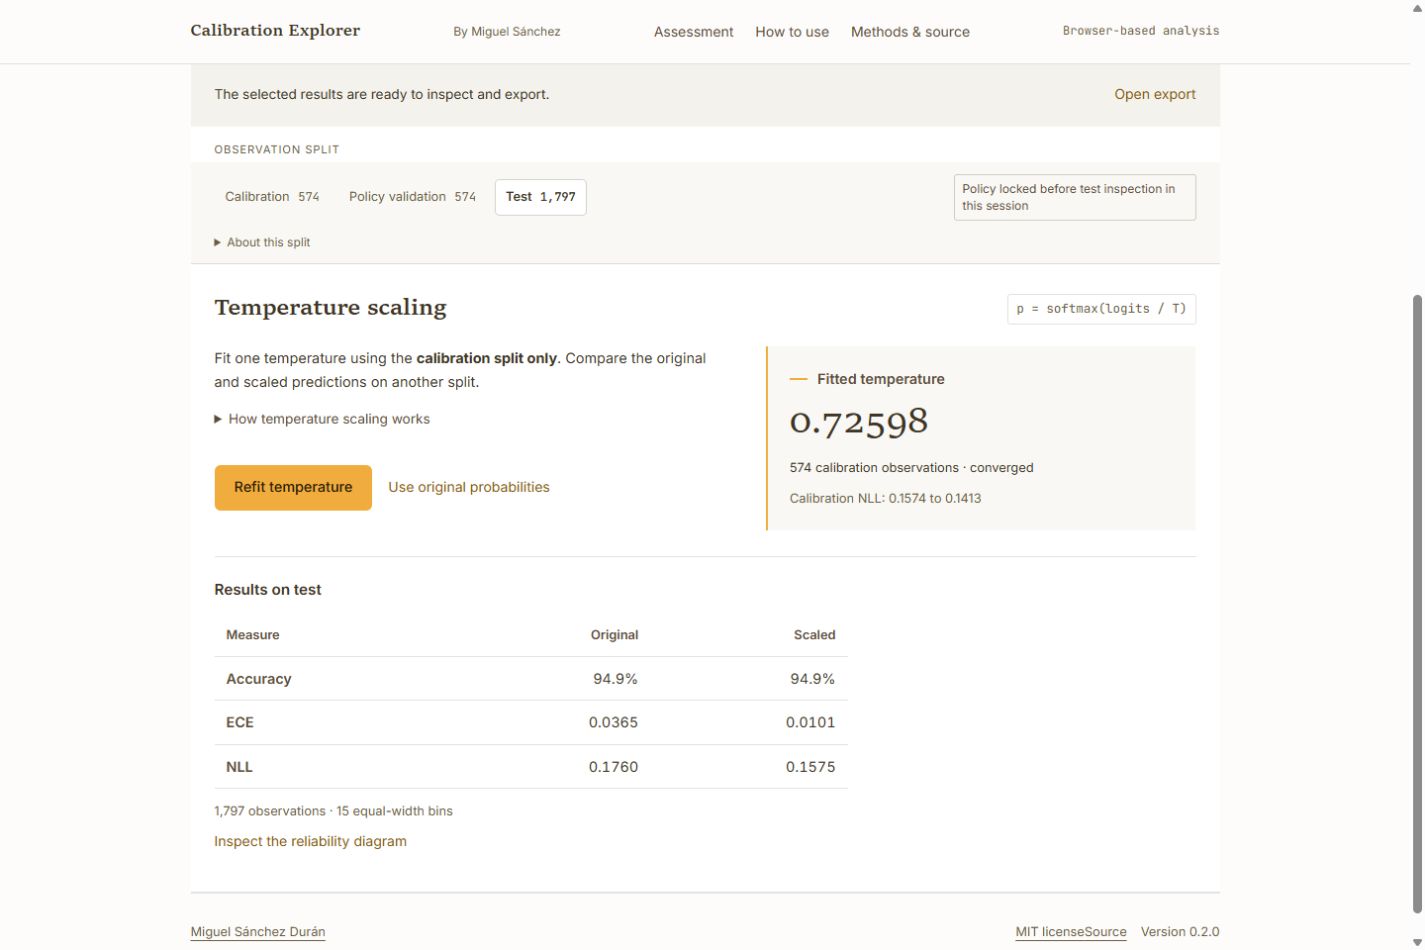
Minimising negative log-likelihood on the calibration rows gives T = 0.72597839. Each class logit is divided by this positive temperature before softmax. The highest-scoring class remains the same, so this operation cannot improve classification accuracy by changing an answer.
Measure what changed
On the 1,797 test observations, accuracy is unchanged. Both negative log-likelihood and the chosen binned calibration measurement improve in this run.
OriginalScaled
| Measure | Original | Scaled |
|---|---|---|
| Accuracy | 94.88% | 94.88% |
| NLL | 0.1760 | 0.1575 |
| ECE | 0.0365 | 0.0101 |
Logistic regression on UCI digits. T = 0.72598, fitted on 574 separate calibration rows. Lower NLL and ECE were observed in this run; accuracy stayed the same.
ECE uses 15 equal-width bins. Small bins are noisy, and this example does not establish performance on other models or data.
Inspect the recorded measurementsNLL uses the probability assigned to the true class; lower is better. ECE averages the absolute gap between confidence and accuracy within bins, weighted by the number of observations. Its value depends on the bins and sample size. A smaller ECE here is an observed result, not proof of perfect calibration.
Follow the released workflow
The released 0.2.0 interface follows the same reference from policy validation through calibration, a locked threshold, explicit test review and report export. The numerical dependency and reference results are unchanged.
Calibration Explorer 0.2.0, captured 4 October 2026 with the public UCI digits reference. The 80% threshold is illustrative. These agent-operated checks involved zero independent human participants.
Read the six steps and view the screenshots
Load the reference
Load the handwritten-digit reference. Policy validation is selected; the 1,797 test rows remain unopened.
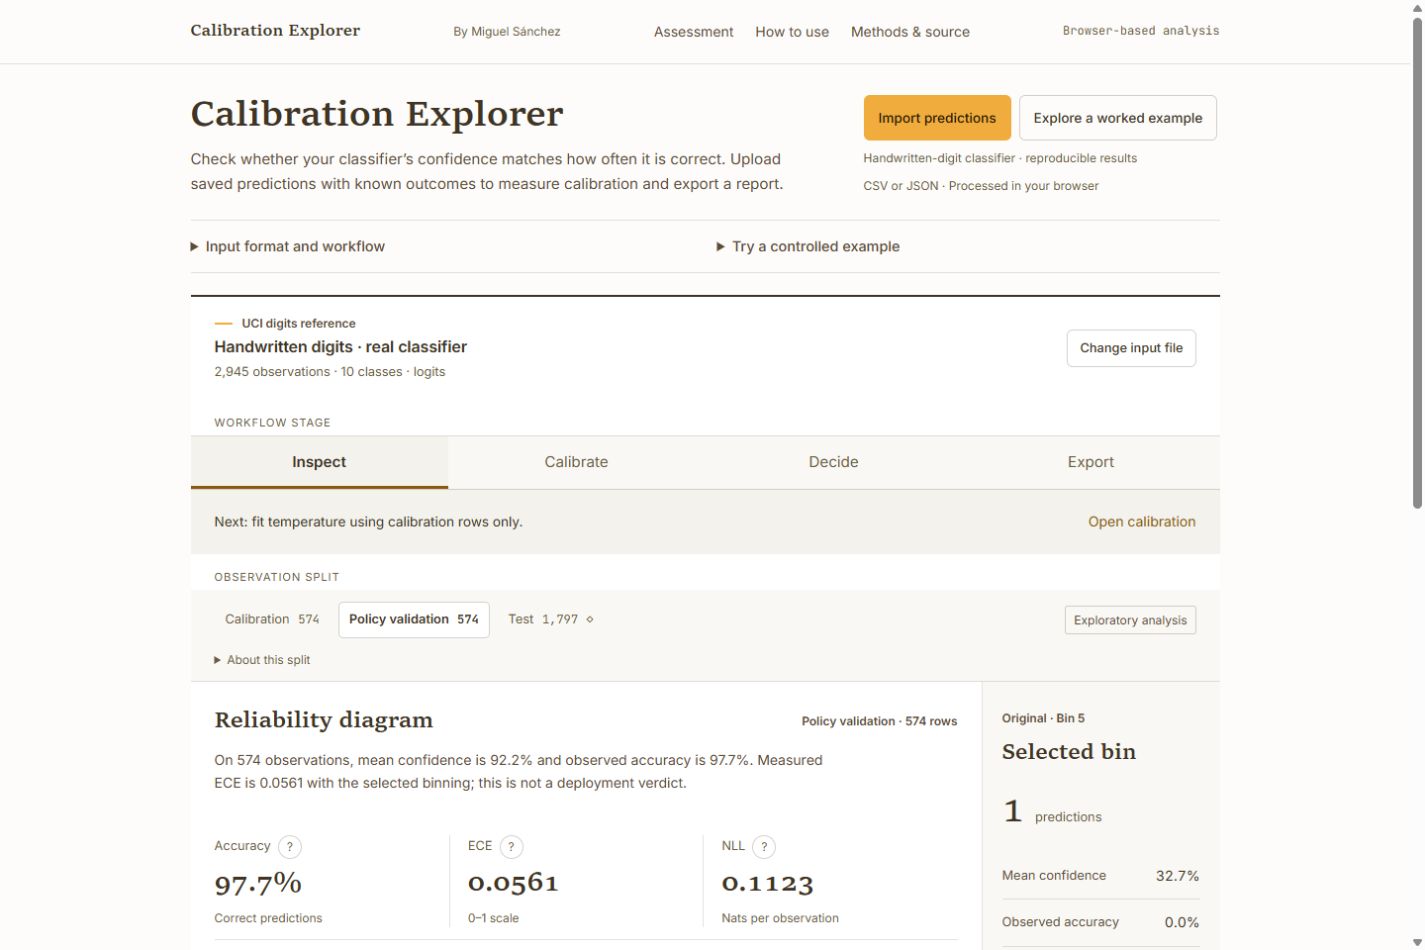
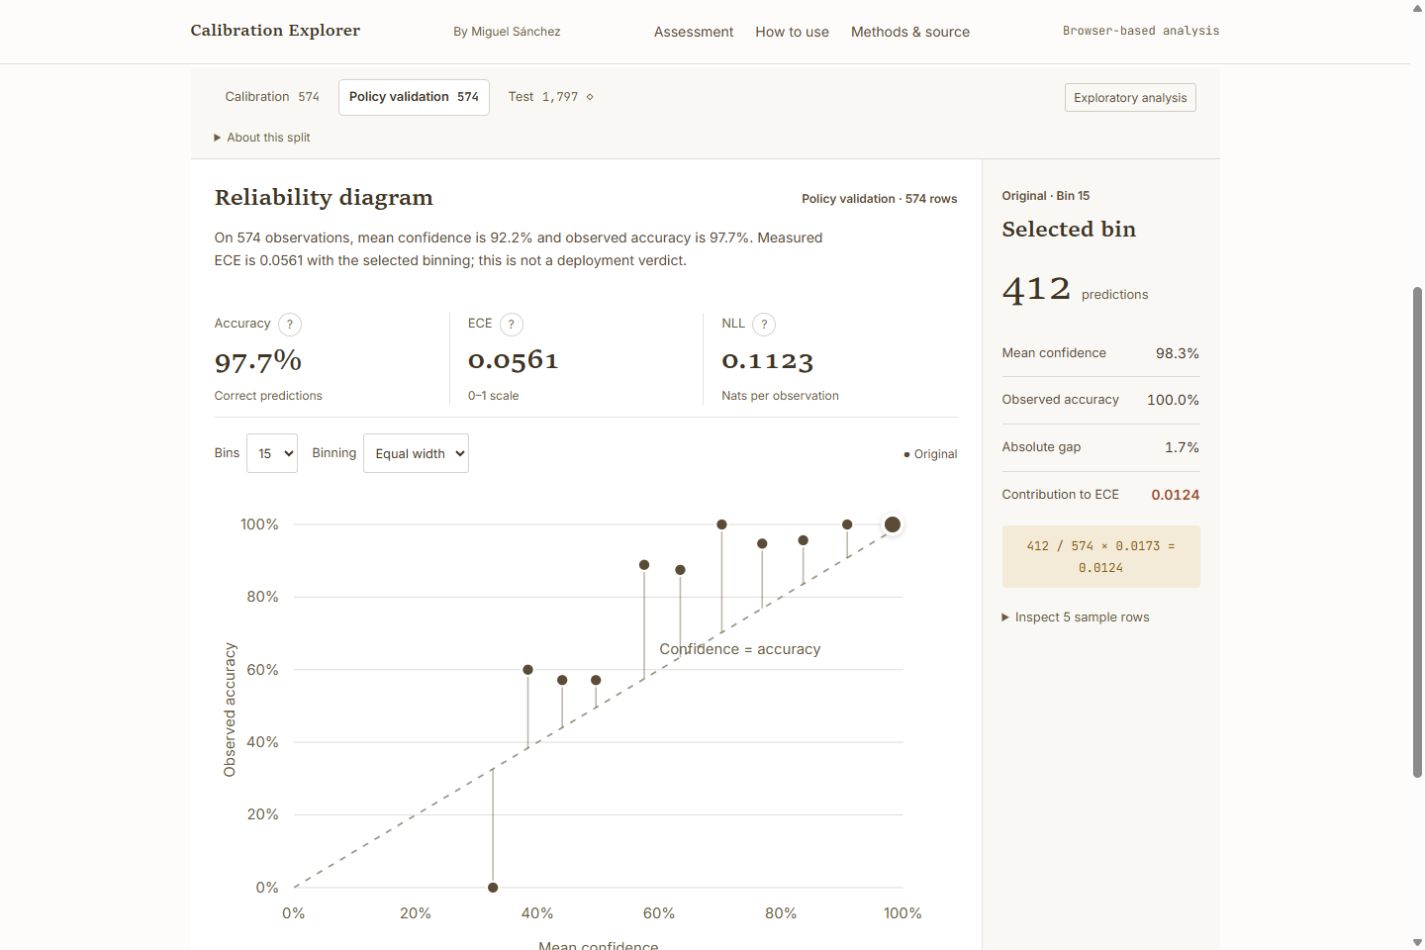
Inspect a linked reliability bin
Select original bin 15: 412 predictions, 98.3% mean confidence and 100% observed accuracy.
Fit on calibration rows
Fit temperature using only 574 calibration rows. The fitted value is 0.72598.
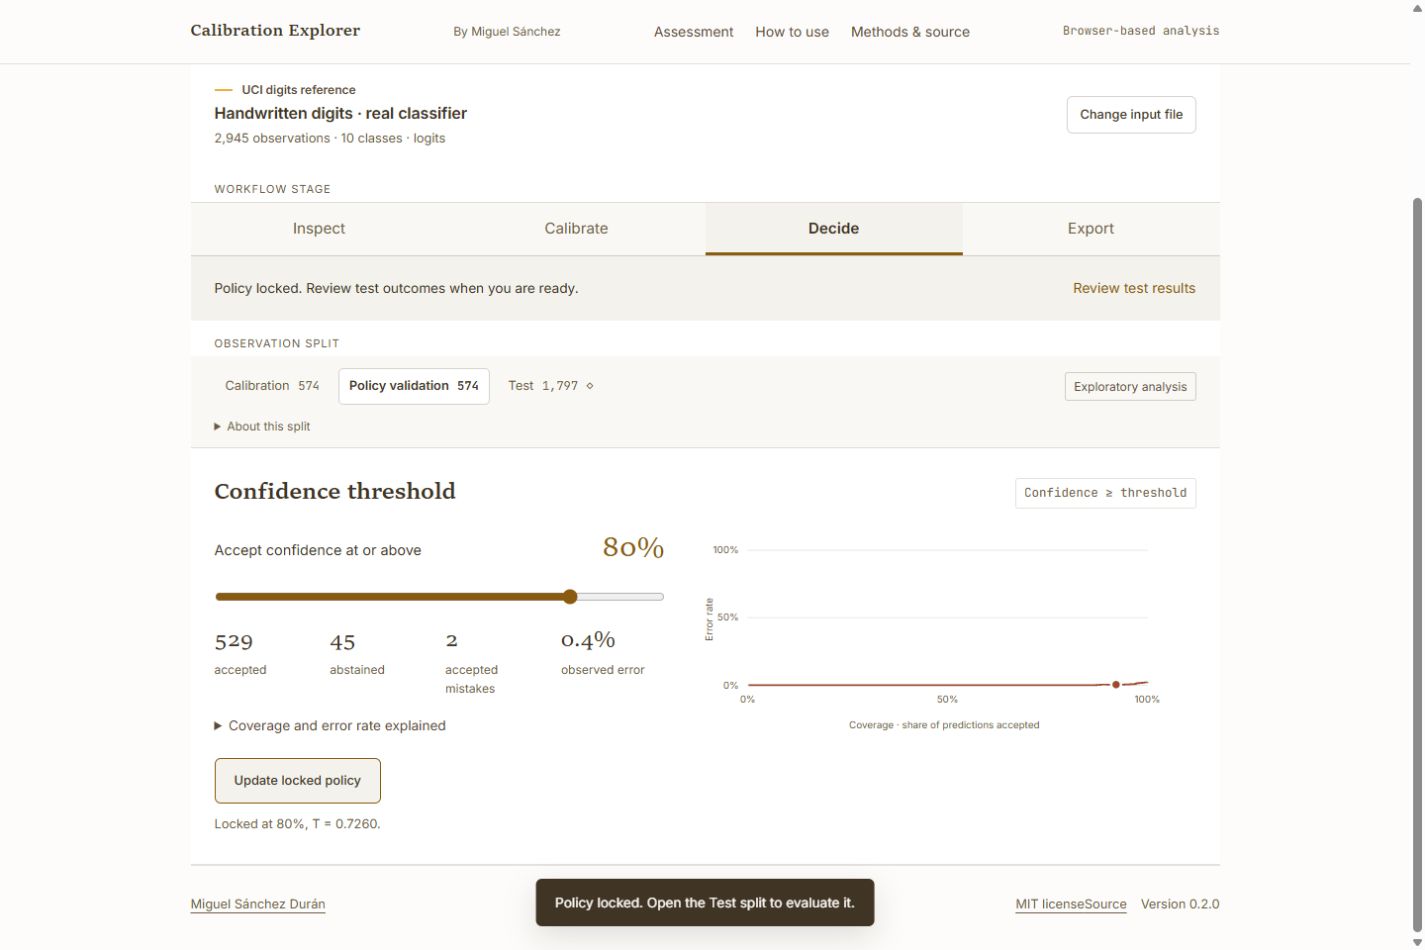
Lock an illustrative threshold
Lock an illustrative 80% threshold on policy validation before opening the test split.
Review the test comparison
Review 1,797 test predictions. Accuracy stays at 94.9%; NLL changes from 0.1760 to 0.1575.
Preview and save the report
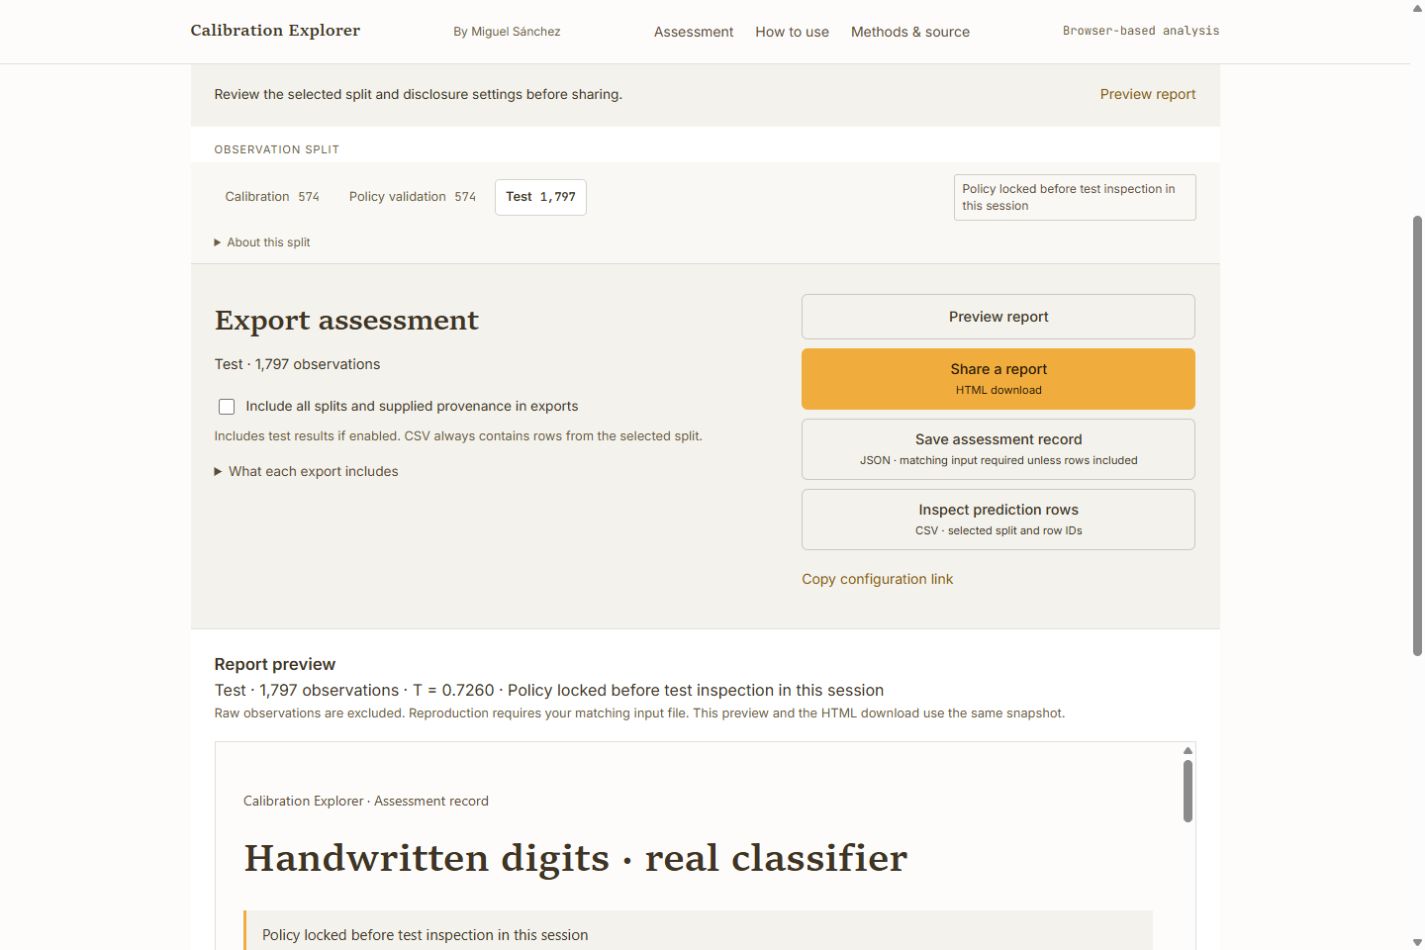
Preview the test report. Source rows are excluded; the actual HTML download matches this preview.
Confidence affects which predictions you accept
The recorded workflow uses an illustrative 80% confidence threshold, fixed before test inspection and assessed on policy-validation data. It was not optimised or recommended. Applied to the scaled test predictions, it accepts 1,635 observations with 31 errors and abstains on the remaining 162.
Those counts describe a specific decision rule on a specific dataset. They do not choose the cost of an error or an abstention for another application. Temperature can also change confidence rankings across observations, so acceptance outcomes need to be measured rather than inferred from unchanged accuracy.
Keep the record and the limits
This result was recorded with Calibration Explorer 0.1.0 and @m-sanchez/calibrated 2.0.1. The public experiment record preserves the input hash, fitted temperature, split, binning, threshold, and measured outcomes. The source and reproduction instructions include the saved predictions and data preparation.
Using the same temperature elsewhere requires the same model, preprocessing, and class order. Changing the population or encountering drift calls for fresh evaluation. Even the reference’s training-derived partitions cannot be claimed writer-independent because per-observation writer identities are unavailable.
The app’s lock records whether a policy was fixed before test inspection in that browser session. It cannot establish whether someone examined the data elsewhere, and it makes no automatic deployment decision. Open Calibration Explorer to inspect the reference or bring your own predictions.